So this is a lovely error message to wake up to in the morning:
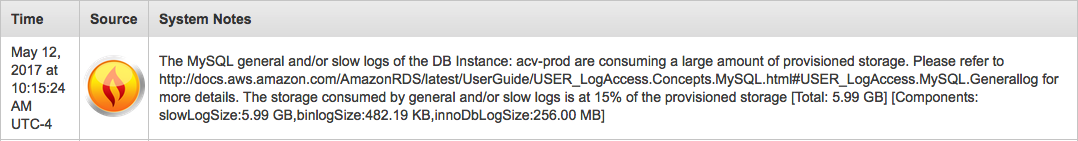
6 GB of slow logs? Holy hell. Ok. First of all, it's important to know what a slow log is. Queries that match certain criteria are quantified as "slow", from the MySQL documentation:
The slow query log consists of SQL statements that took more than
long_query_timeseconds to execute and required at leastmin_examined_row_limitrows to be examined. The minimum and default values oflong_query_timeare 0 and 10, respectively. The value can be specified to a resolution of microseconds. For logging to a file, times are written including the microseconds part. For logging to tables, only integer times are written; the microseconds part is ignored.
These values are enabled and adjusted using what's called a parameter group. You can view your current RDS parameter groups by going into the RDS Console and navigating to Parameter Groups. The default parameter groups will already be there, as shown below:
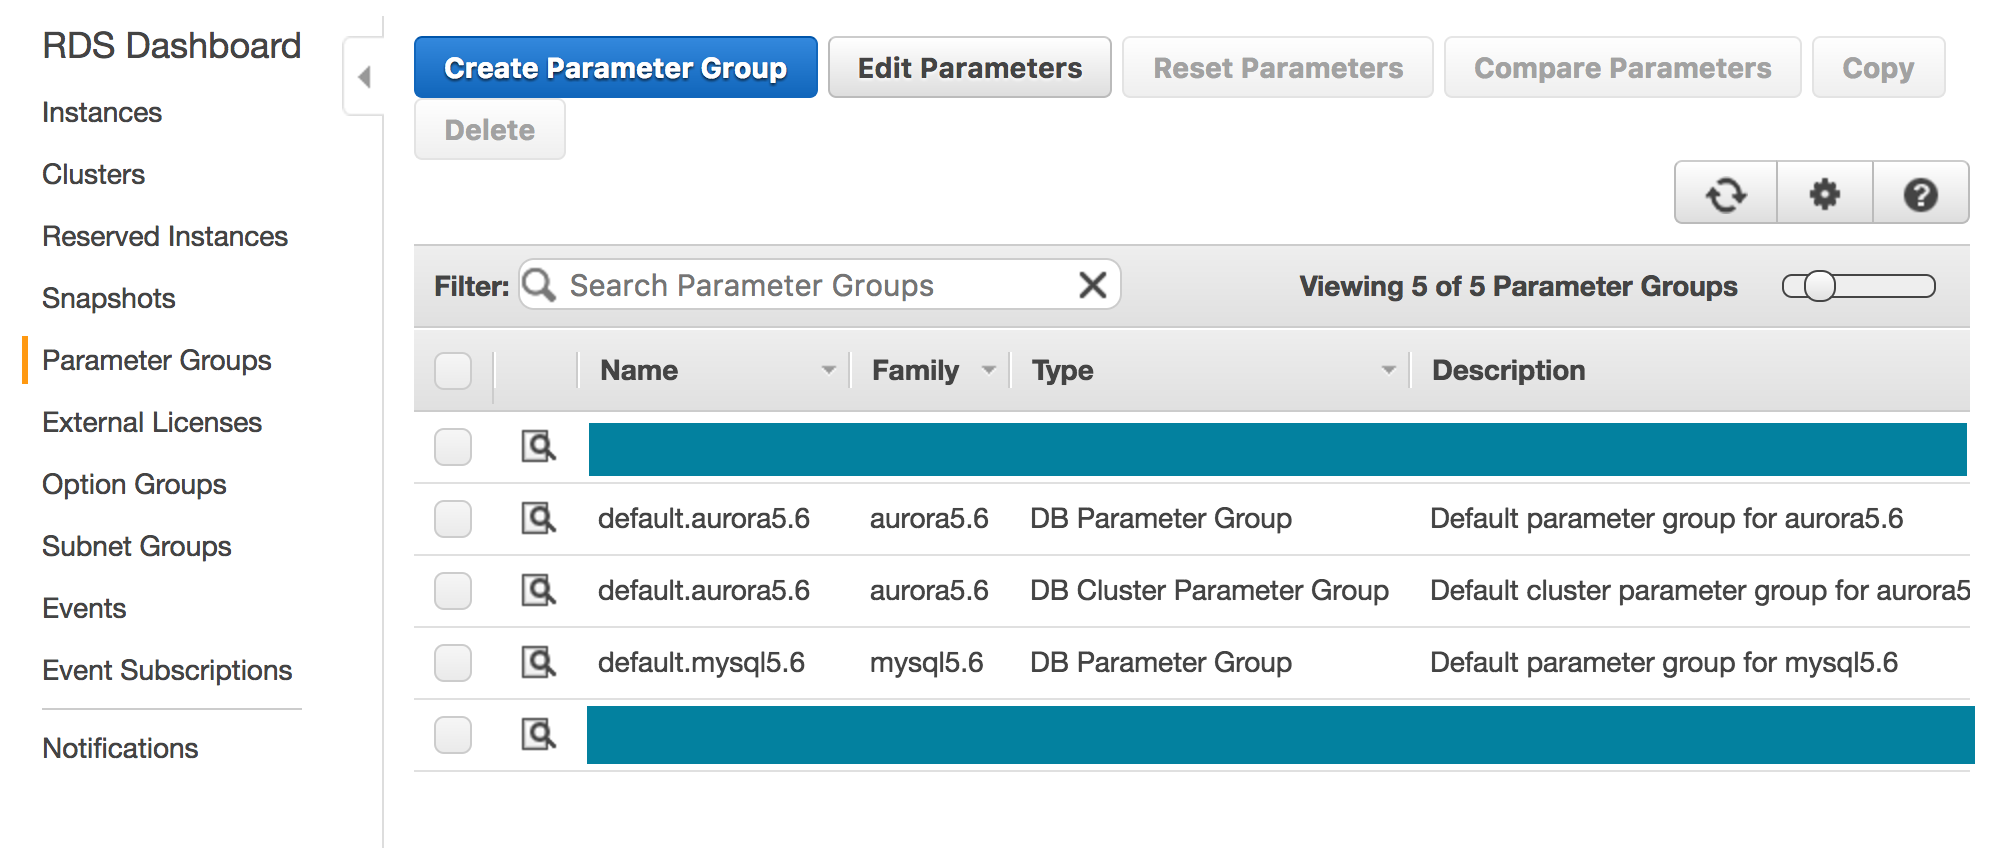
As you can see, there are a couple non-default parameter groups in here. One of those is for the database in question: amongst other things, it enables slow logging.
At this point I decided to do two things: take quick look at the slow log files and then take a look at the parameter groups to see what these values are. My thought was that I'd take a look at the logged queries look like, see if they made sense, and then adjust the long_query_time and min_examined_row_limit values accordingly. Alas, the files were empty. S'wha? So, where're my logs?
Well, there's another parameter in question: log_output. log_output allows you to specify whether you'd like your general and slow log files to go to files or to table. Ours was set to table. So that means we had a 6 GB slow log table.
Ho boy.
When writing to table, the slow log table is in the mysql database in slow_log and slow_log_backup. For reference, the general logs are in the same database also nicely named as general_logs and general_logs_backup. For the slow_logs in particular, it's worth mentioning that at this point the slow_logs tables are so large that running queries against them is a less-than-AWSome experience.
Since we haven't had a need to make use of these yet, I decided to start by just clearing out the tables. The AWS documentation (linked in the references at the bottom) explains what queries to run to do this manually. From the command prompt:
$ mysql -h my-database.rds.amazonaws.com -u myadmin -p -e "CALL mysql.rds_rotate_slow_log;"
If you need to flush the general_logs as well, the command is similar:
$ mysql -h my-database.rds.amazonaws.com -u myadmin -p -e "CALL mysql.rds_rotate_general_log;"
Depending on your needs you may want to schedule an outage window. I intentionally did this off hours a couple days later (a Sunday) just in case rotating / dropping so many log records caused performance issues.
I took the time to do a bit more reading and found this in an AWS Premium Support doc:
Log tables keep growing until the respective logging activities are turned off.
Yeah. We're switching that logging to file. AWS rotates log files every hour and they persist for 24h. So that should be more than adequate, moving forward. The plan at this point was to let it sit and see how large the log files grew. The parameter group was set up before I was brought in and doesn't appear to have been changed to anyone's recollection, so over a year later it's hard to gauge how quickly the tables grew when querying the slow_logs table was ... slow.
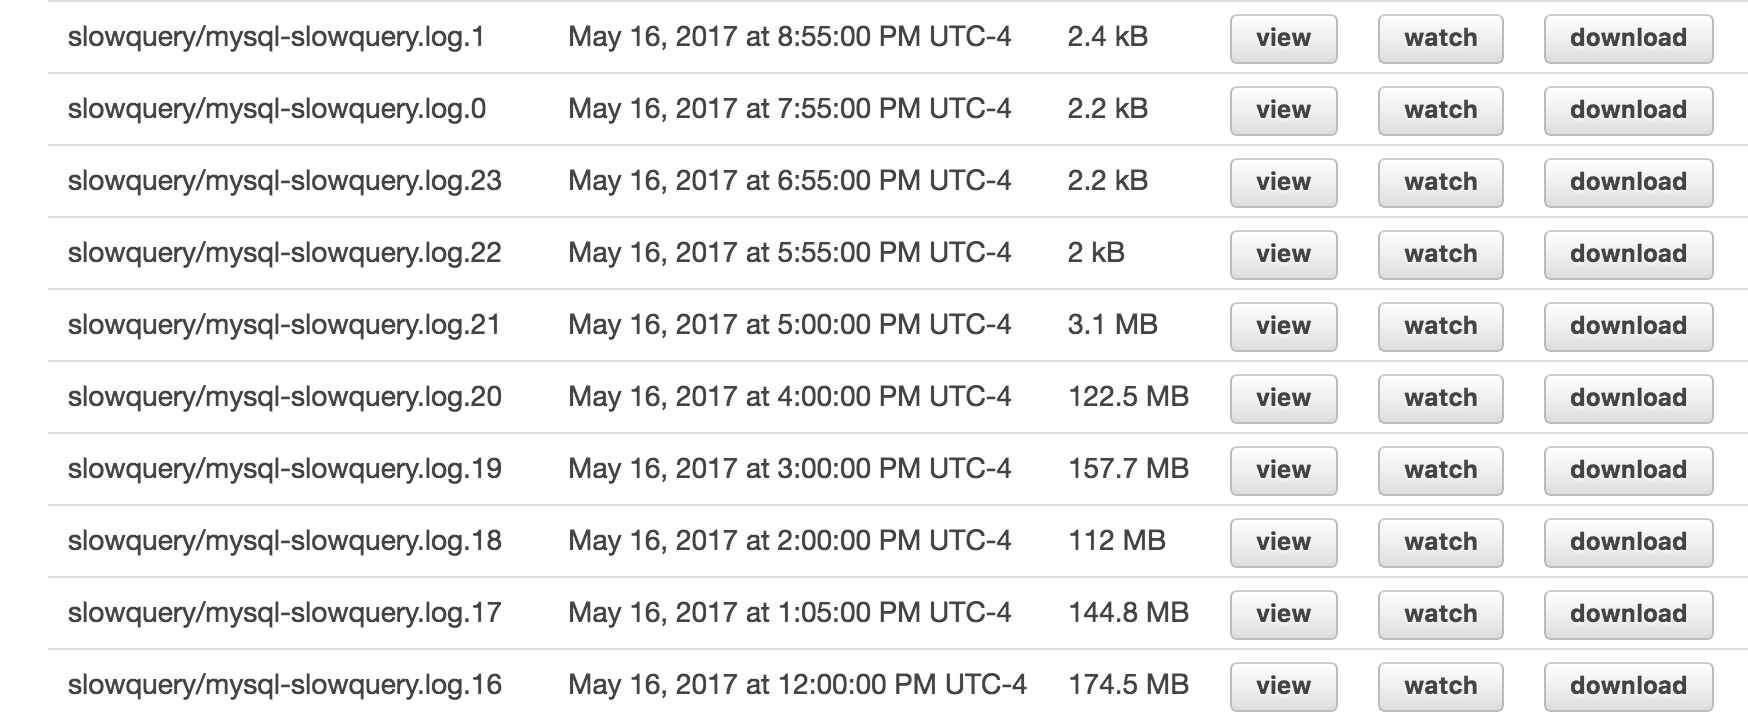
24 Hours Later
So logging was still less than ideal. Even though the logs are rotated every hour each log file was 100-200 MB (not a typo). How much data is this? 200+ "slow queries" a second at times:
$  cat mysql-slowquery.log  | grep "SET" | sort | uniq -c | sort -rn | head -n 30
 282 SET timestamp=1494858722;
 281 SET timestamp=1494858855;
 277 SET timestamp=1494858854;
 273 SET timestamp=1494857771;
 256 SET timestamp=1494858721;
 247 SET timestamp=1494858856;
 240 SET timestamp=1494858780;
 240 SET timestamp=1494858461;
 239 SET timestamp=1494858731;
 238 SET timestamp=1494858867;
 237 SET timestamp=1494858865;
 235 SET timestamp=1494858464;
 233 SET timestamp=1494858439;
SMF. Were they legitimately slow in my human opinion? Well:
/rdsdbbin/mysql/bin/mysqld, Version: 5.6.34-log (MySQL Community Server (GPL)). started with:
Tcp port: 3306  Unix socket: /tmp/mysql.sock
Time                 Id Command    Argument
# User@Host: myadmin[myadmin] @  [xx.xx.xx.xx]  Id: 12345
# Query_time: 0.000573  Lock_time: 0.000207 Rows_sent: 1  Rows_examined: 2
...
Two rows examined and less than a second to complete? Our min_examined_row_limit is 10 and our long_query_time is 3s. Time to find out what other parameters could be involved in this.
After only a little digging, it turned out the culprit was log_queries_not_using_indexes. This is a BOOL that when enabled means every query that is run without using an index is written to the log file. Most of our queries do not use indices, so I disabled it and crossed my fingers:
Log files immediately contracted when I disabled log_queries_not_using_indexes.
Huzzah! Log files are sane once again.
By the way, if it turns out that you do need to log_queries_not_using_indexes I highly recommend also making use of log_throttle_queries_not_using_indexes to limit how many of this type of query can be written to the slow log per minute. Just sayin'
Relevant Documentation
- AWS RDS doc: MySQL Database Log Files
- AWS Premium Support: How do I enable and monitor logs for my Amazon RDS MySQL instance?
- MySQL 5.7 Reference: 5.4.5 The Slow Query Log
- MySQL 5.7 Reference: 5.1.5 Server System Variables

Documented on my frequently used assets page.